I created a hands-on workshop on the principles of visual design to help data scientists learn and practice design skills. I taught the workshop at two IEEE Vis conferences (in 2012 in Seattle and in 2013 in Atlanta) and to university students in London.
Data scientists work with huge datasets generated in areas such as bioscience, urban transport, or social media. They often build software tools to visualise and better understand those large sets of data. Yet, many of them have insufficient design training to make good visualisation choices.
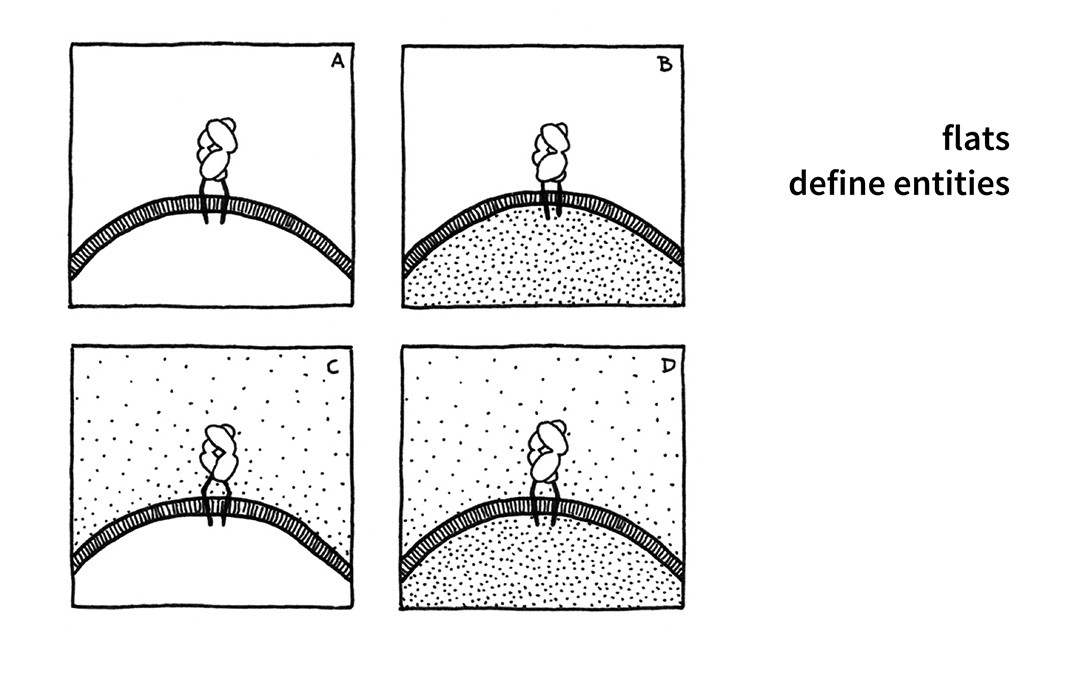
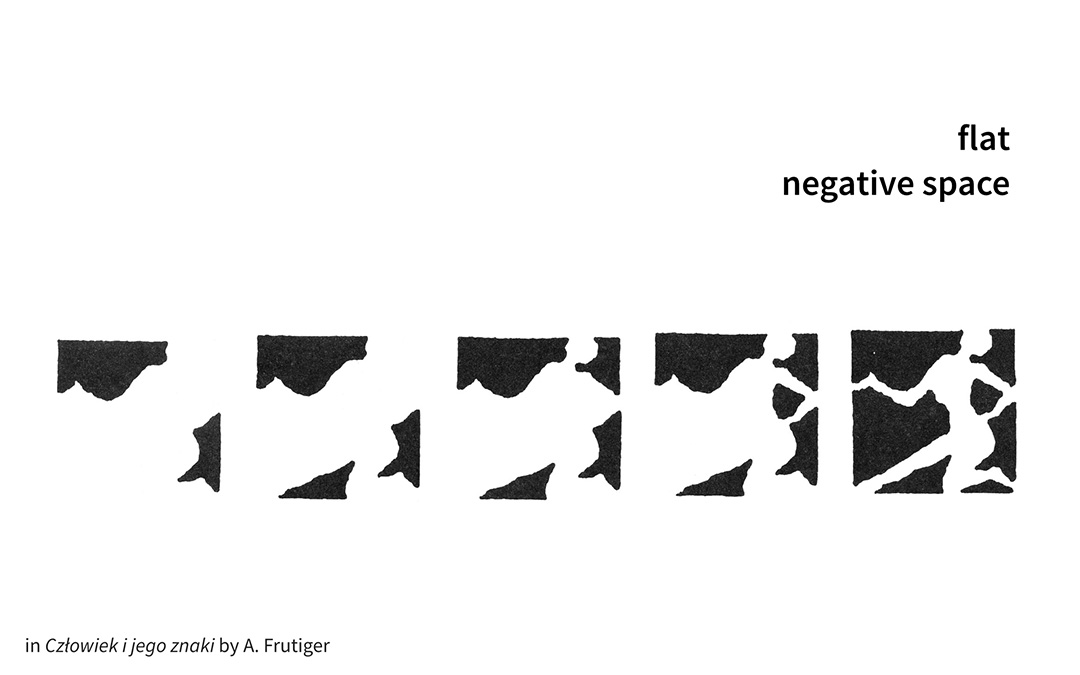
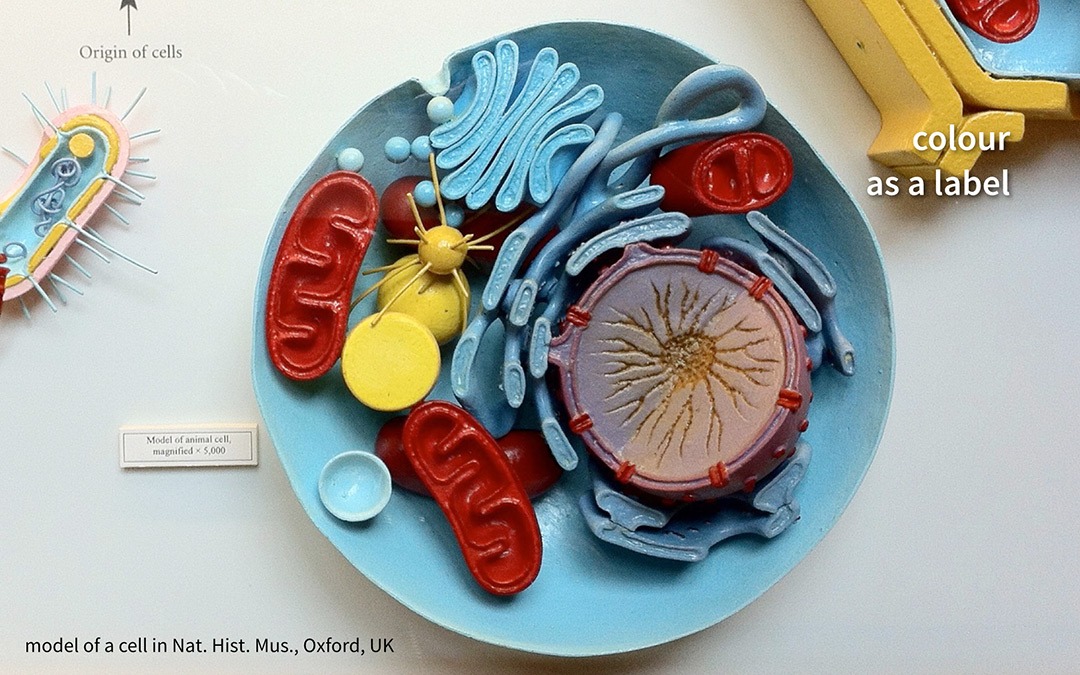
The workshop starts with a 90-minute introduction to basic elements of visual design: a point, a line, surface, colour, typography, and a grid.
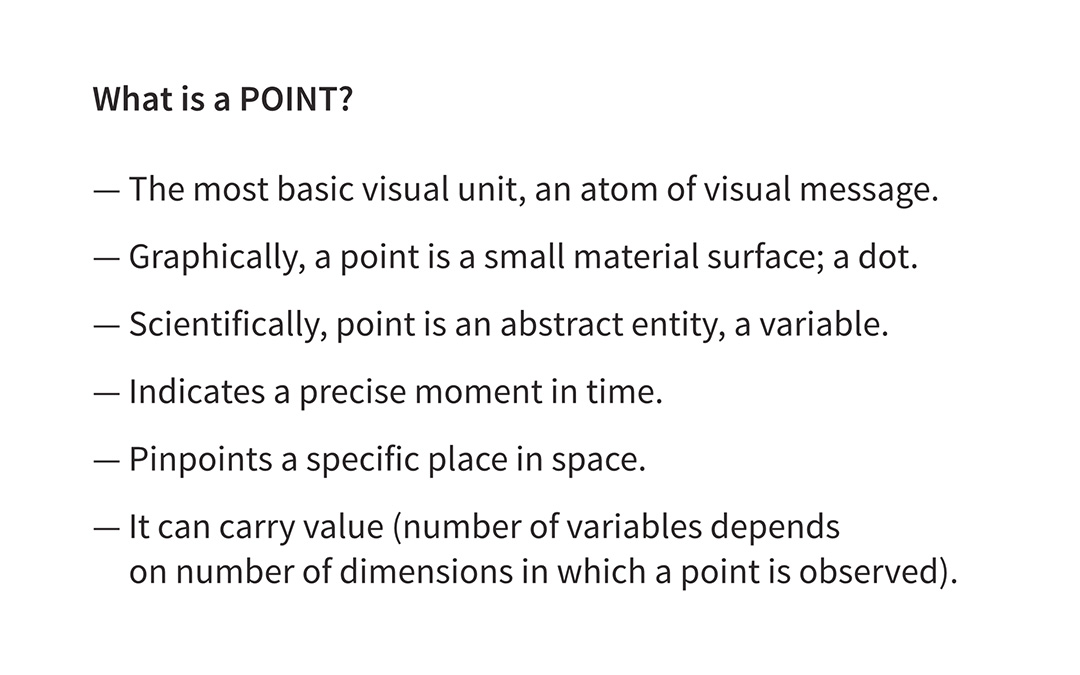
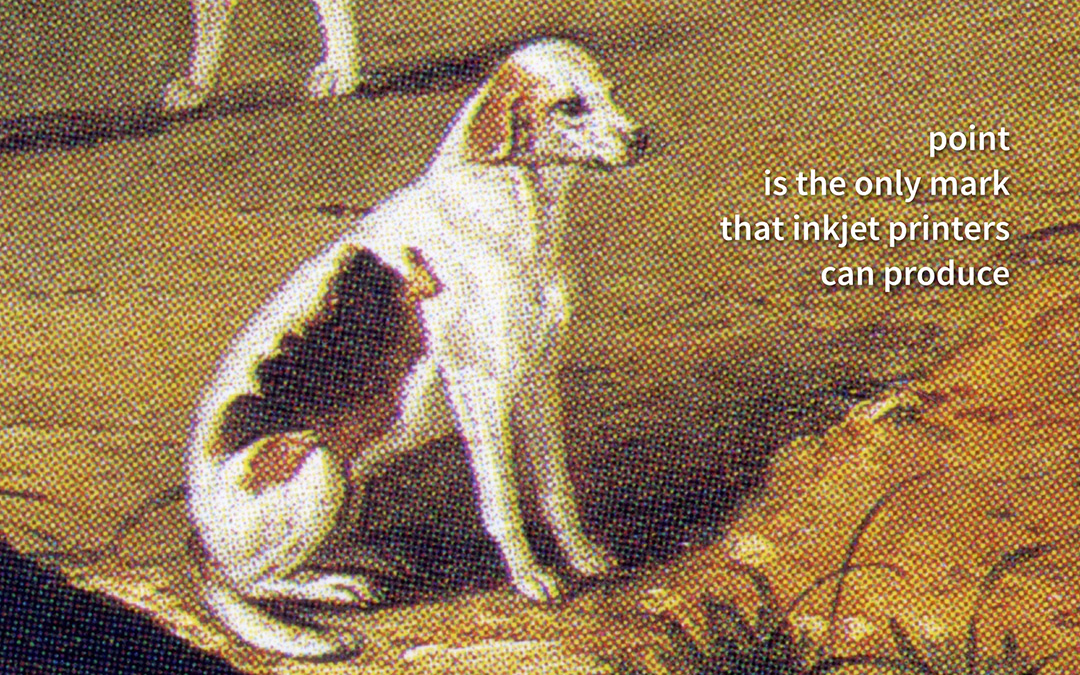
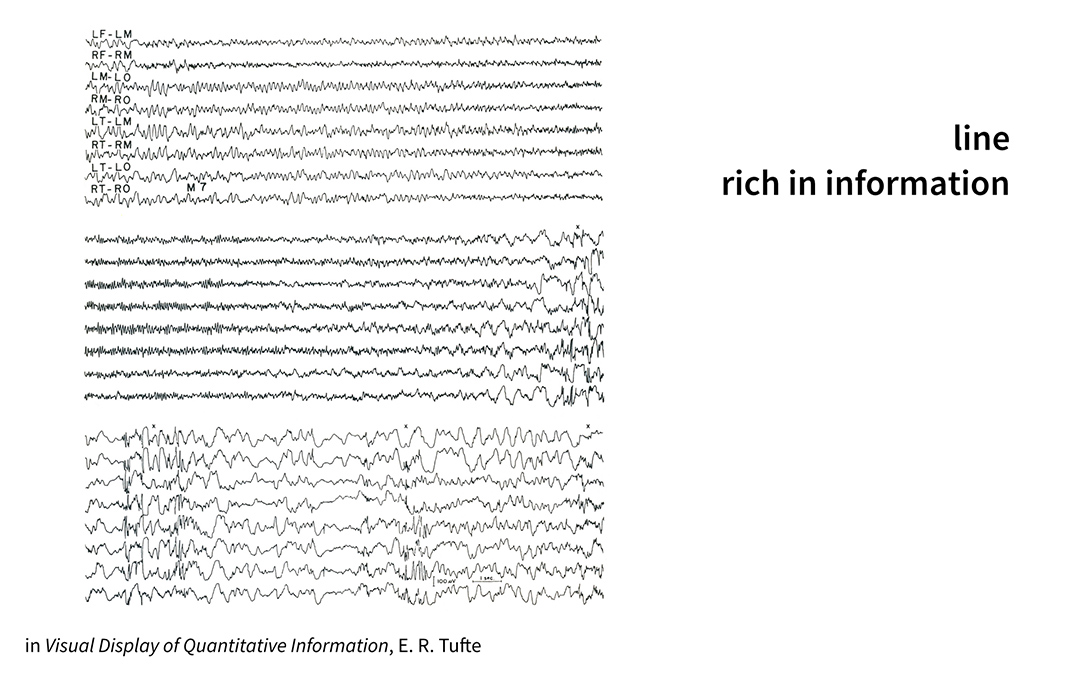
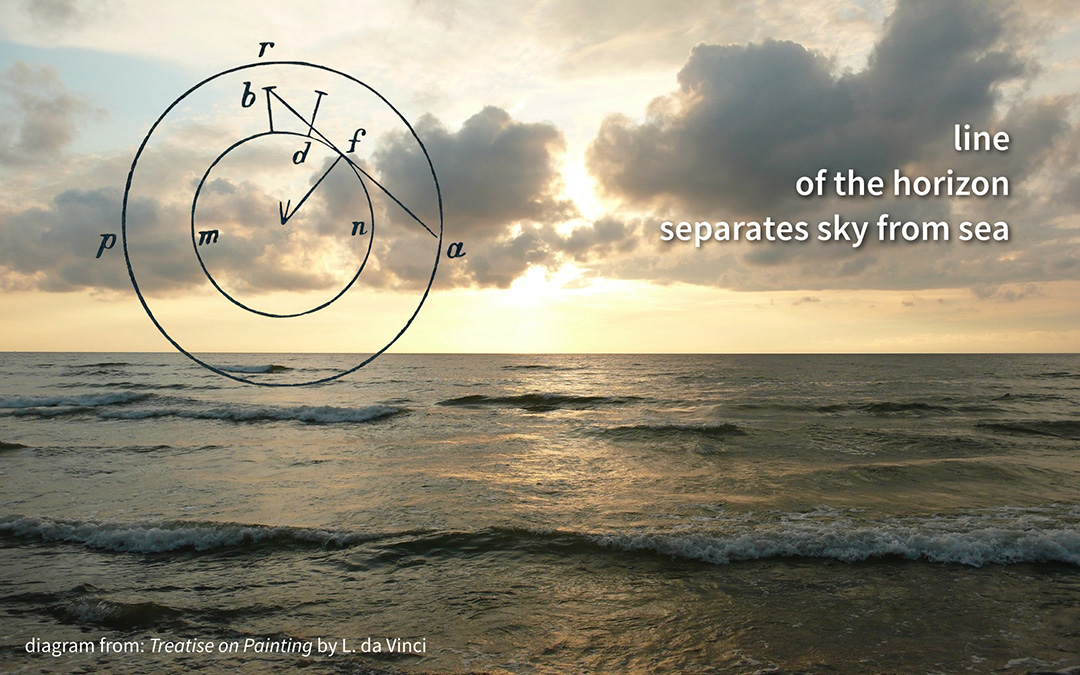
I discuss cases of good and poor use of design elements. This provides participants with a theoretical background and some inspiration for the practical part of the workshop which comes next.

The theoretical introduction is followed by a hands-on exercise. Workshop participants are given a small dataset with a few features that are difficult to visualise. Using paper and colour pencils only (no computers allowed!) participants have to think outside of the box to come up with the best ways to visualise and interpret this data.
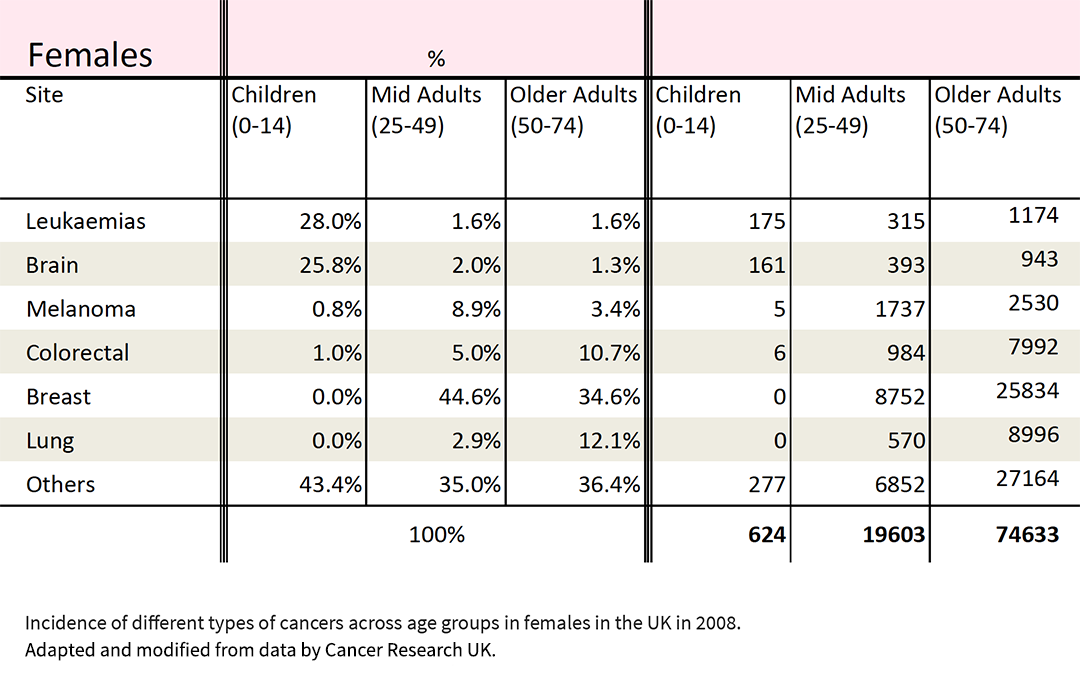
Data source: Cancer Research UK
In the last part of the workshop, participants present their work to others and discuss their design decisions. A public crit allows everyone to see a range of possibilities for visualising the dataset. It also helps to understand how different design choices influence one's perception of data. Below sketches made by VisWeek2012 workshop participants.
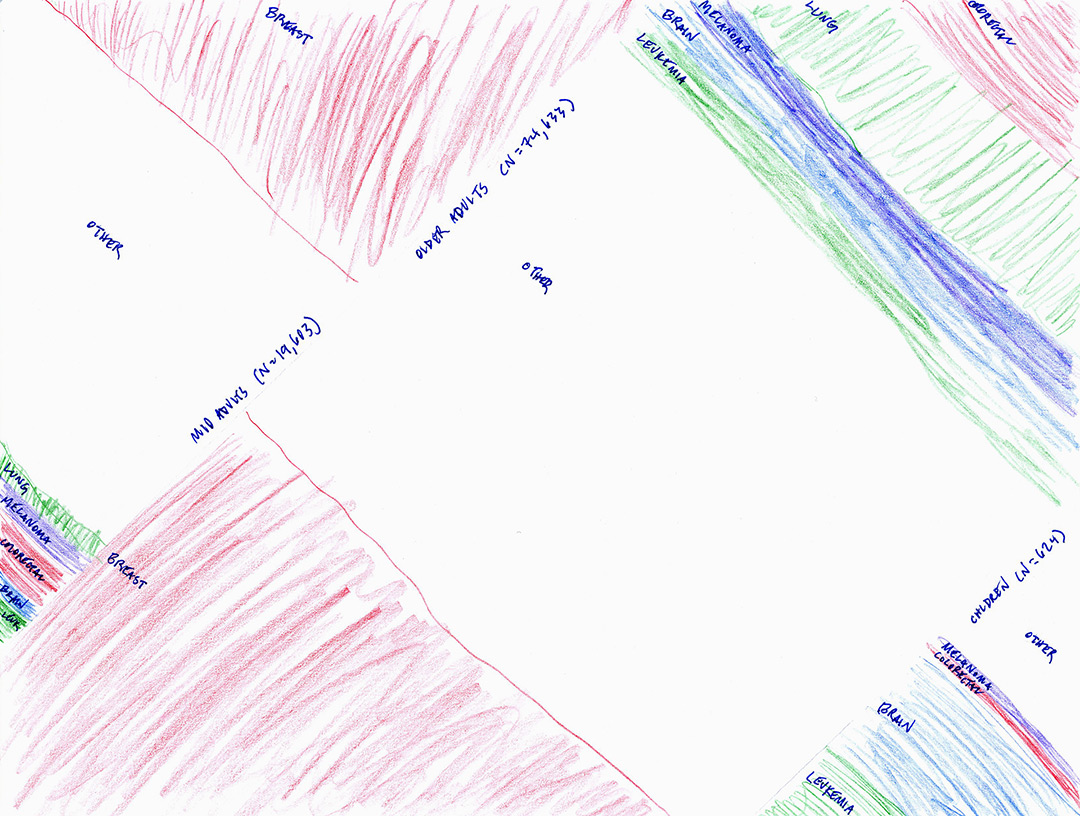
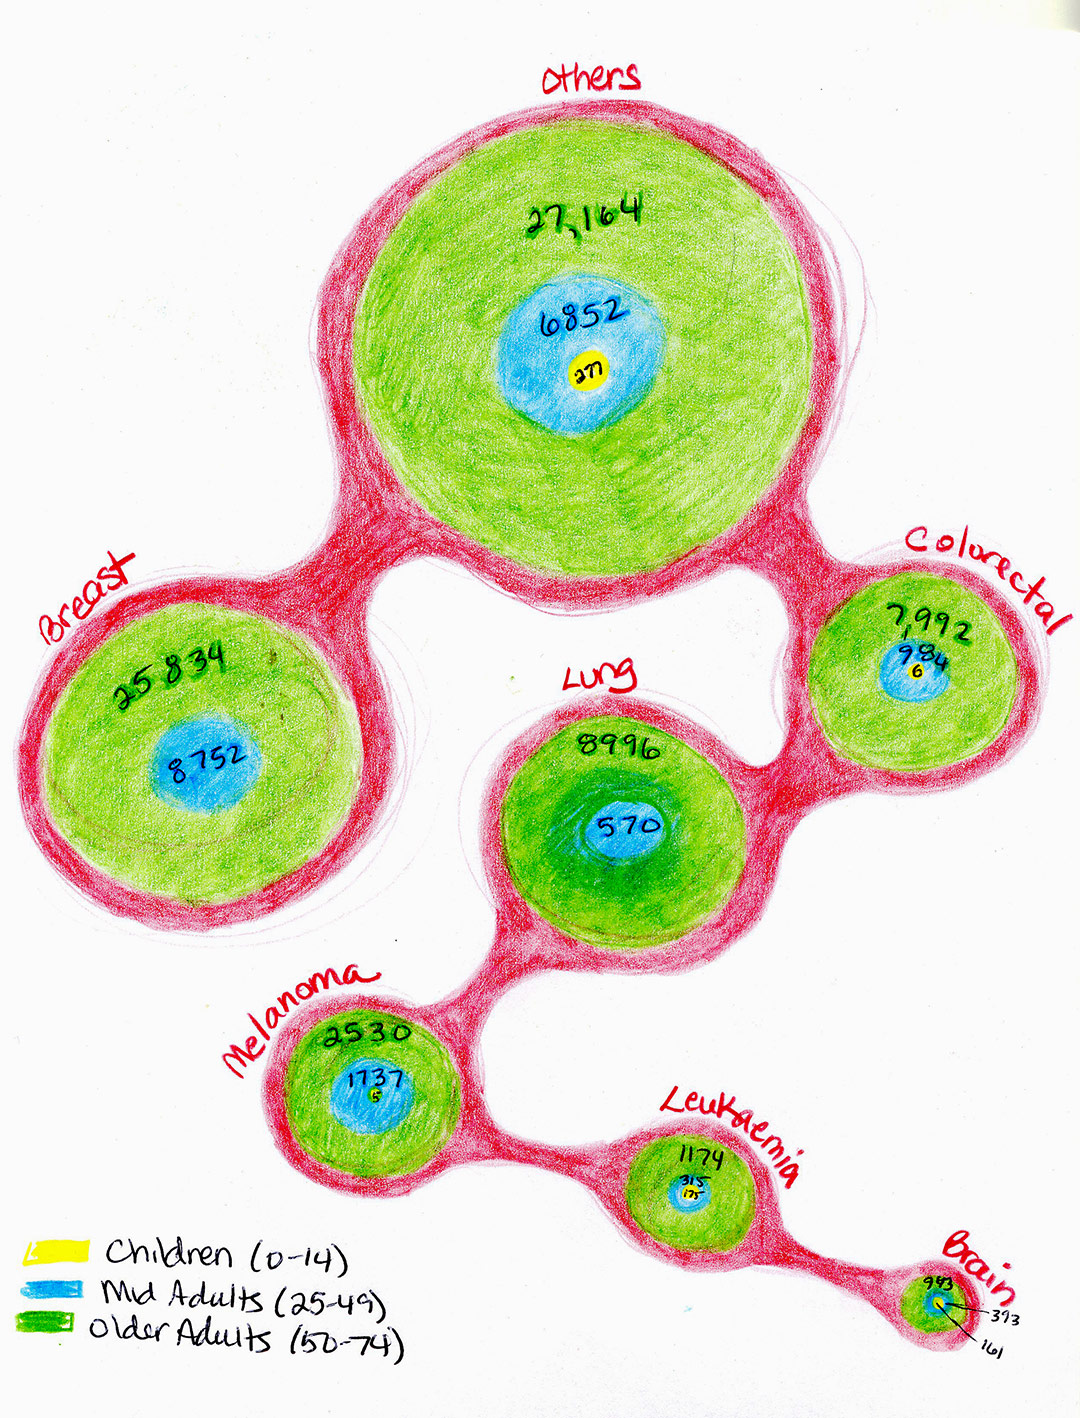
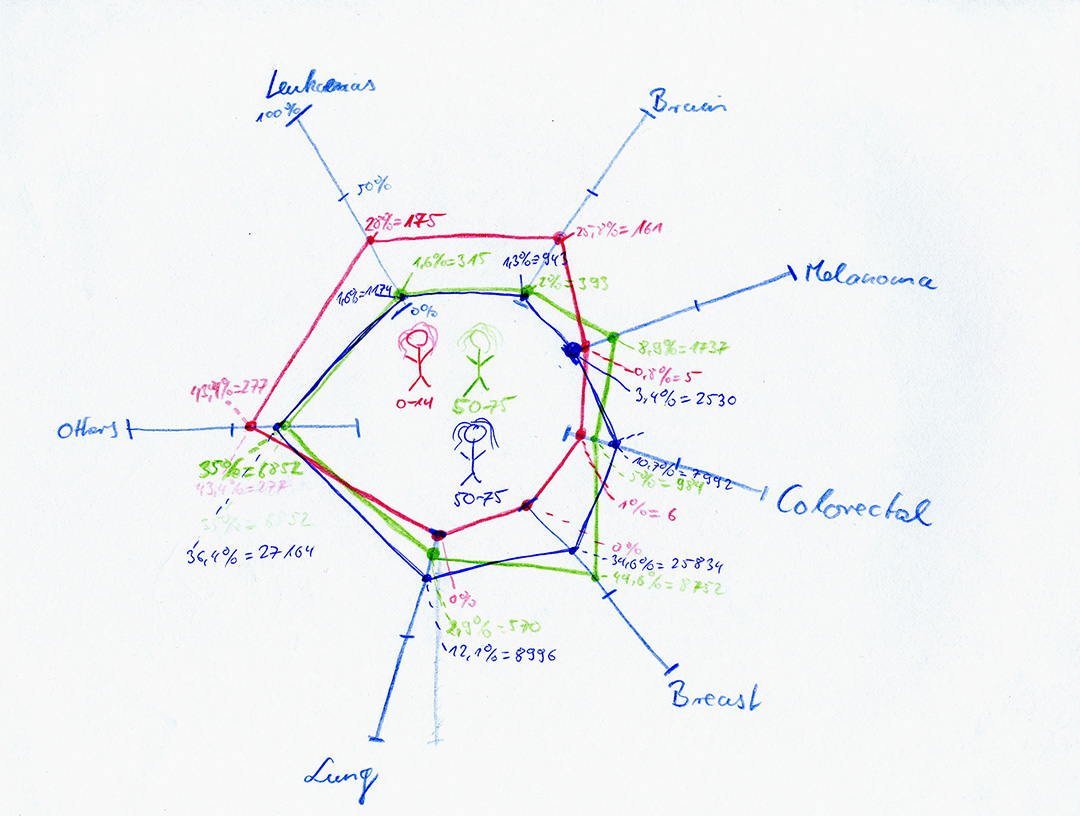
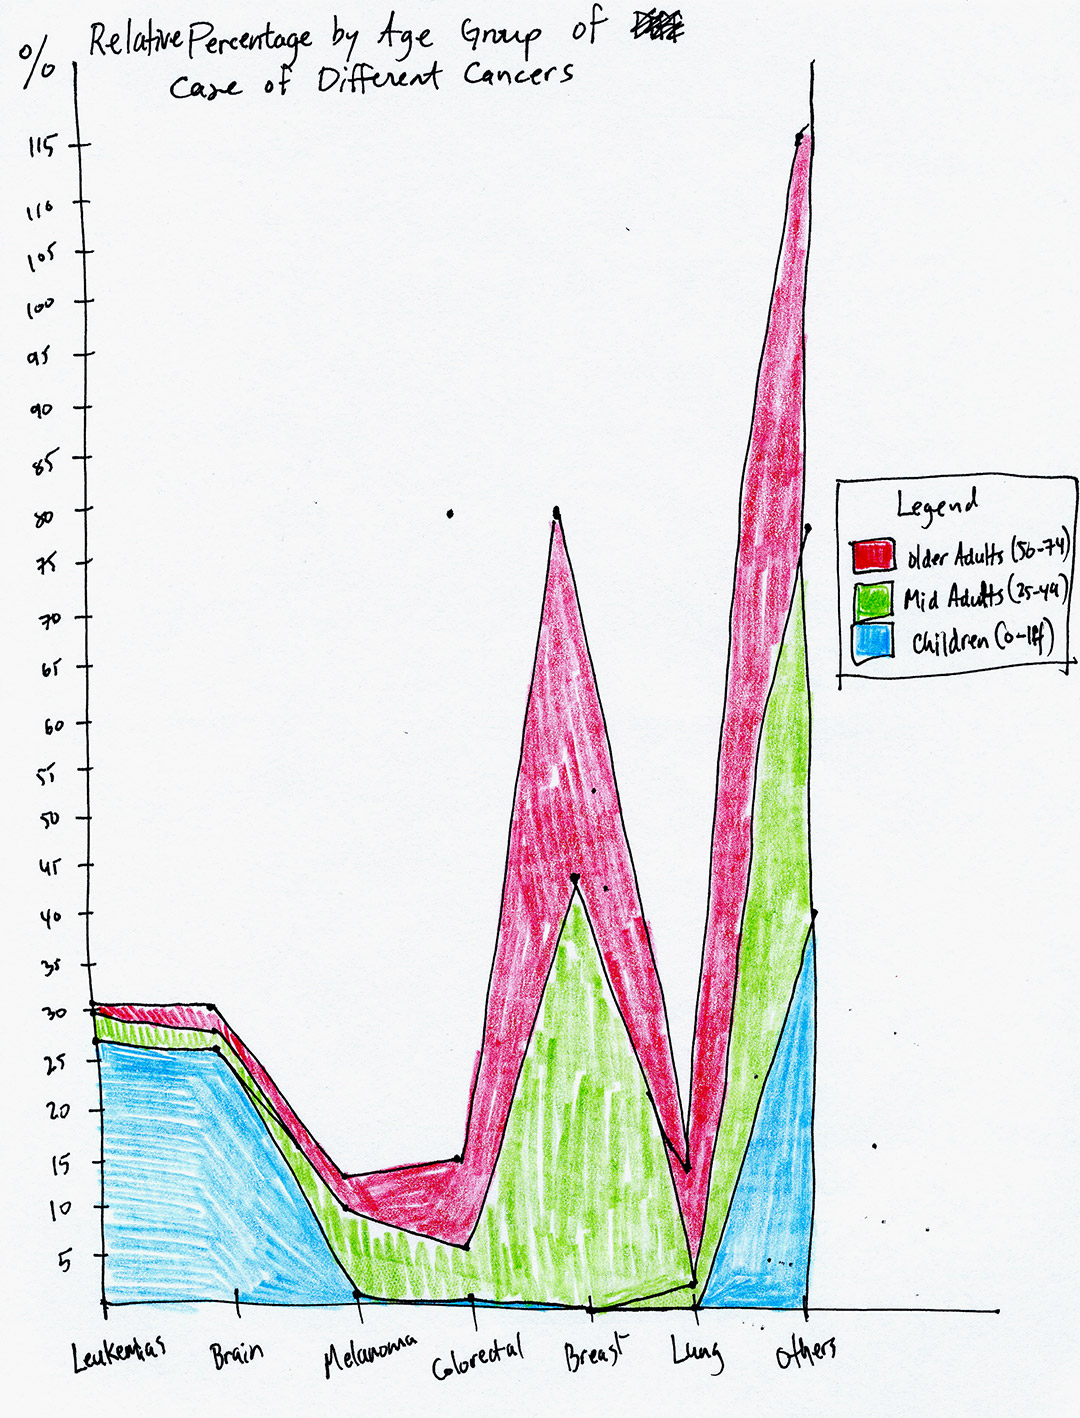
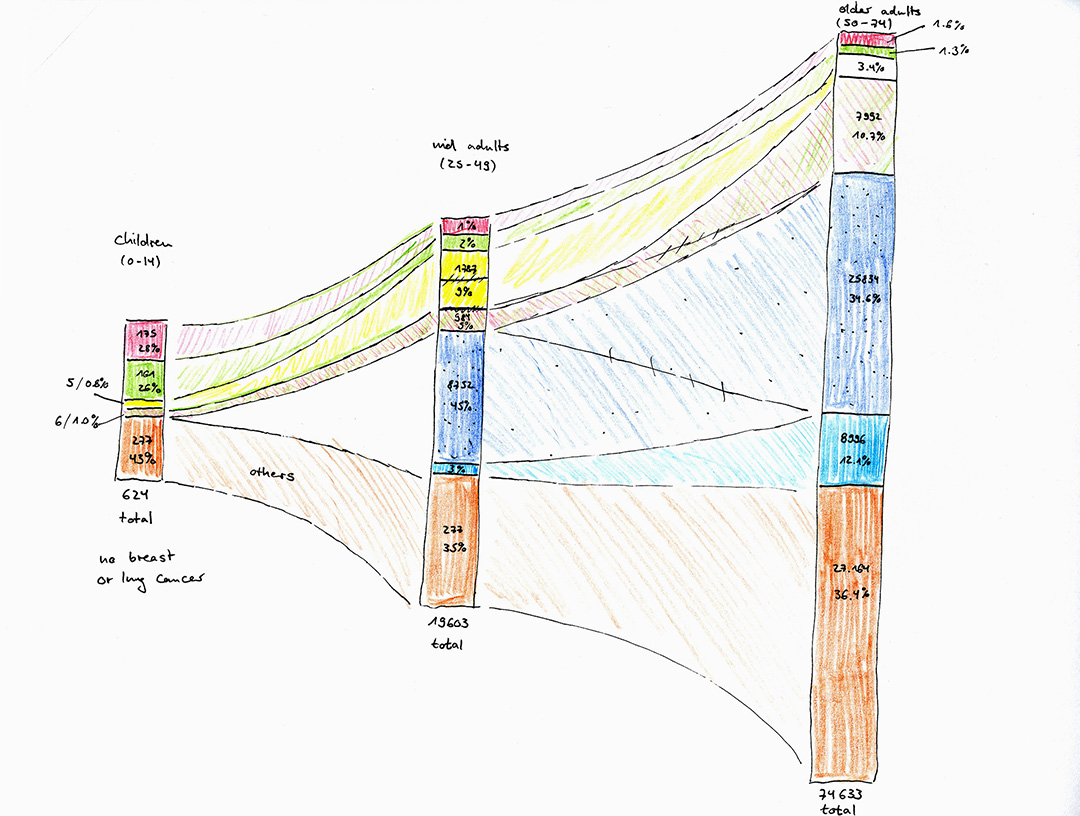
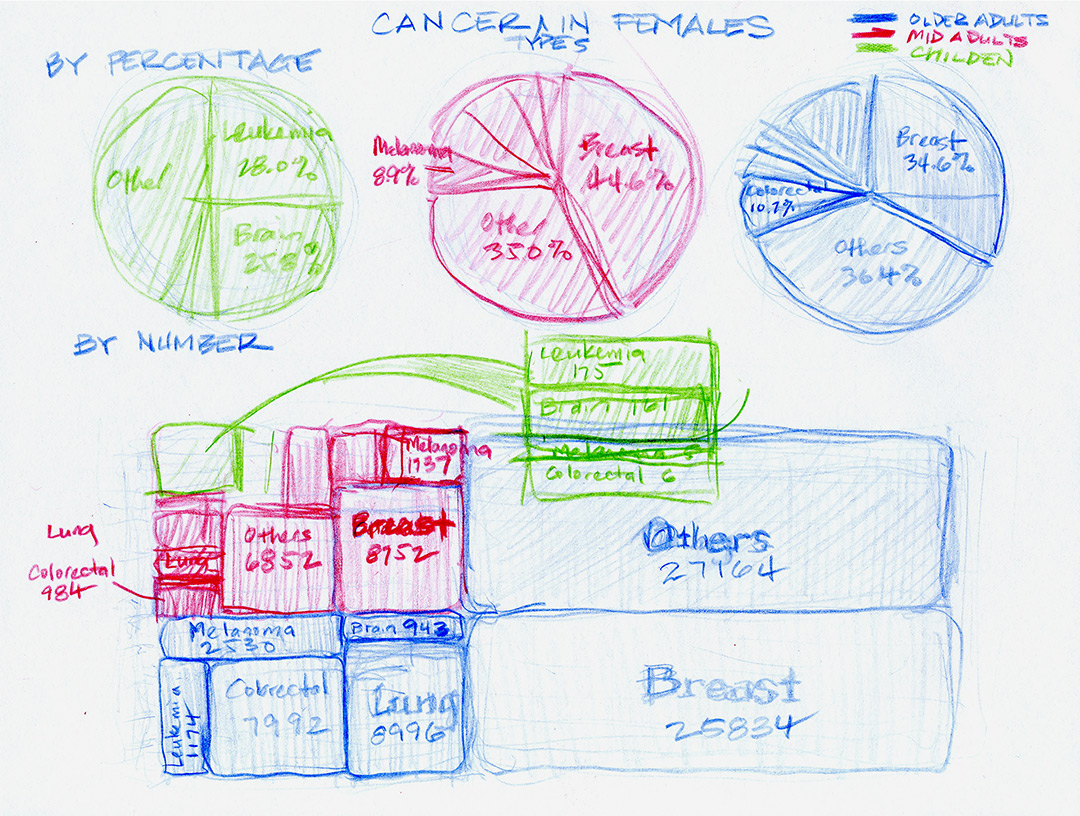
Sketches by the participants of the IEEEVis 2012 workshop
The workshop was included in the Tutorials programme of the IEEE Vis 2012 conference in Seattle and IEEE Vis 2013 conference in Atlanta (Industry & Government Highlights).
In 2012–2014 I also ran the workshop as part of a data vis curriculum for MA students at City University of London.
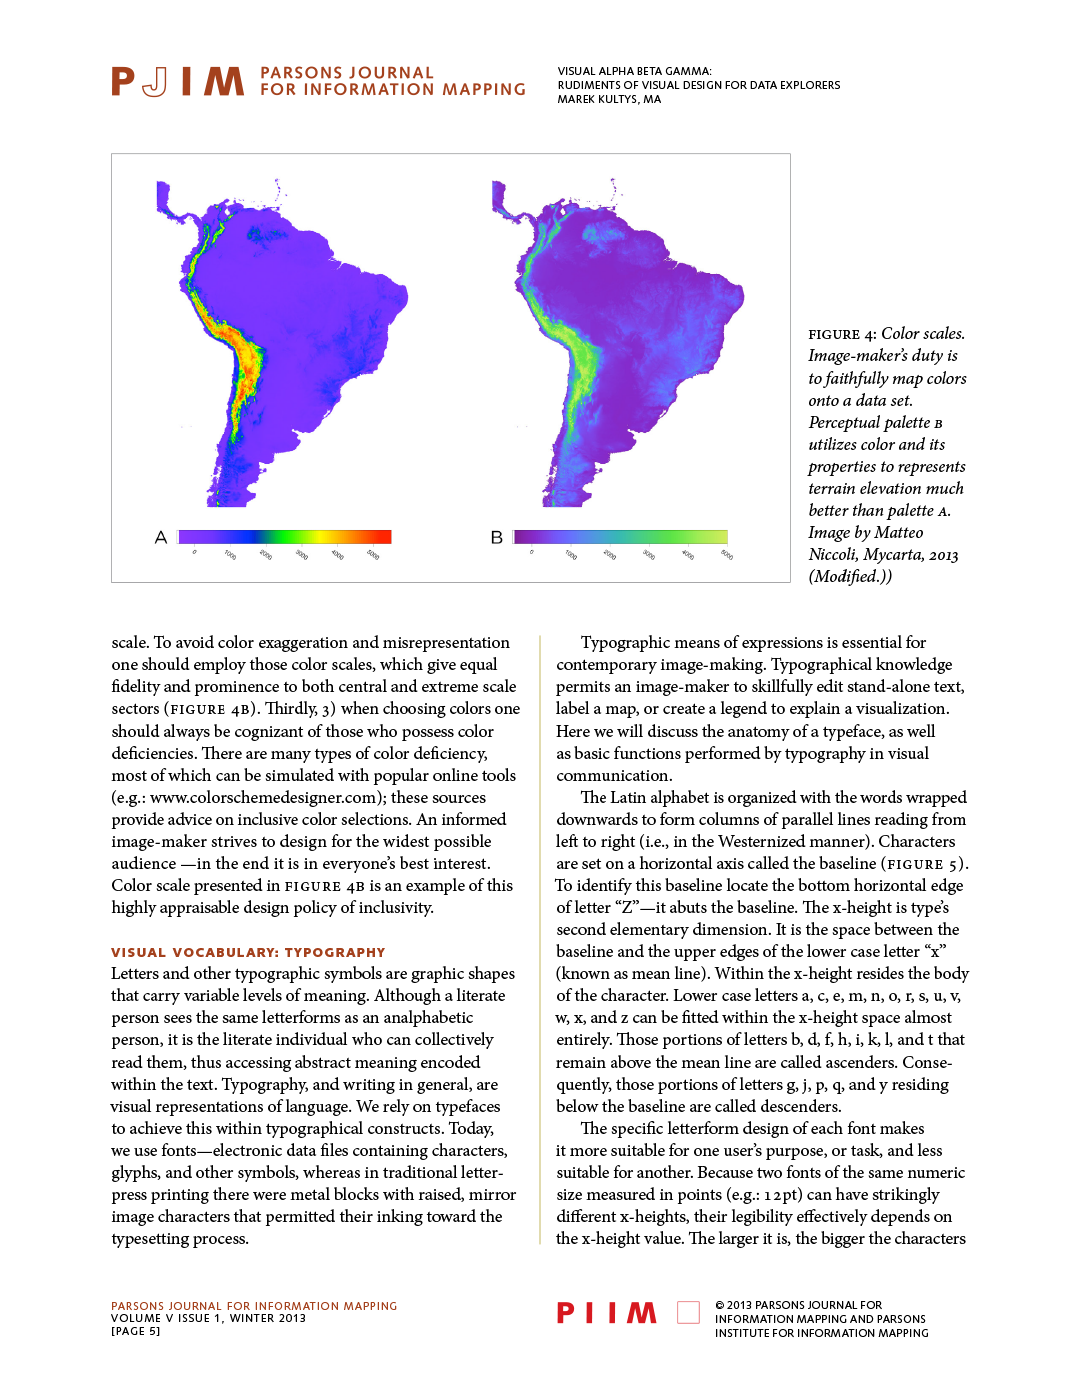
I summarised the workshop in an atrticle published in Parsons Journal for Information Mapping, Volume V, Issue 1, 2013.